
System Monitor
Accessed from the [Help] / [Monitor] menu, the System Monitor provides administrators with the ability to monitor dbFront usage, user activity and also to manage record locks.
Application Status
As part of the heading, the System Monitor includes a quick summary of the dbFront installed application status including alerts if a critical security update is available or if support is about to expire.
Statistics
The first tab of the System Monitor provides quick access to a variety of statistics including:
- Records Inserted,
- Records Updated,
- Records Deleted,
- Record Locks,
- Logins,
- Max Concurrent Session Count (per day),
- Action Button Click Count,
- Reports Run Count,
- Imports Count (Not record count),
- Mass Delete Count (Not record count),
- Mass Update Count (Not record count)
The stats appear in three separate charts that can show approximately 2 weeks of history.
Additional Server statistics and settings are also included.
Record Locks
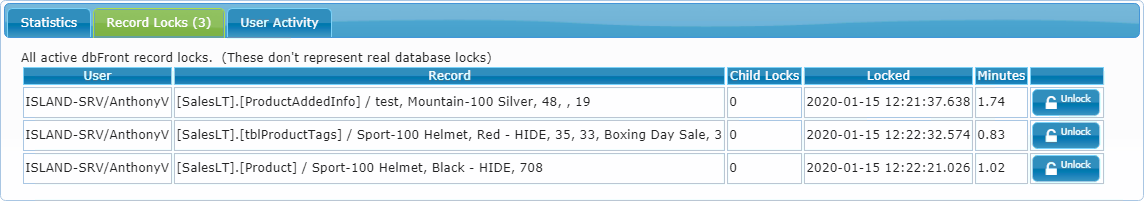
If there are any active Record Locks then the System Monitor Screen will include a Record Locks tab. Administrators can review and delete any record locks as needed from this screen.
User Activity
The User Activity tab summarizes the activity within dbFront based on the source IP of the host. This screen would be used to track down potential abuse.
Status Summary Report
dbFront can optionally send a daily or weekly Status Summary report including the application status, usage statistics charts, and configuration summary. To configure the Status Summary report see: Alerts Setup